
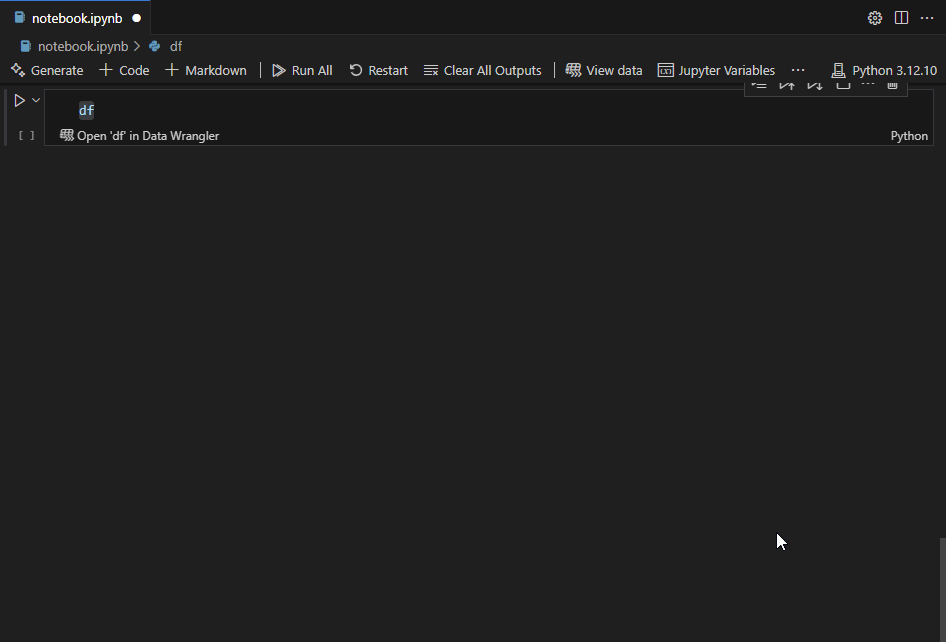
If you have ever found yourself rewriting the last line of a notebook cell repeatedly just to get an overview of your data, you’re not alone. In VS Code the default output for Pandas DataFrames is a static, truncated HTML table and it often fails to answer essential questions, such as:
- Do we have rogue blank values somewhere we did not expect?
- Do the columns we plan on using as keys really contain unique values?
- Are the data types what I expect them to be?
- How many times does a specific value show up in the results?
- What are the last 10 items in this 30k items list?
Check out how Data Wrangler integrates seamlessly with notebooks in VS Code to enable you to answer these questions quickly and easily, with just a few clicks.
Seamless integration with notebooks
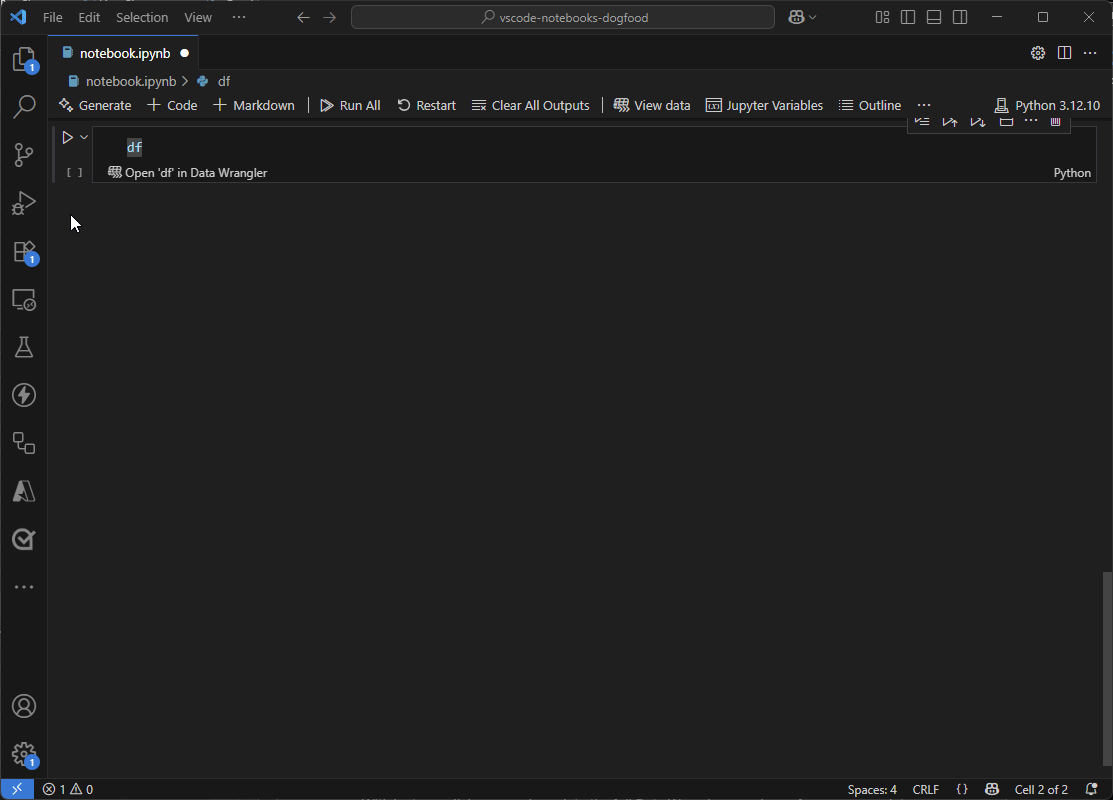
The new experience seamlessly replaces the static HTML output for Pandas DataFrames, only where applicable, and without any additional actions. Just make sure the Data Wrangler extension is installed 
Column sorting and filtering
There is no need to write code for sorting and filtering. You can just click around the interactive UI as you explore the data.
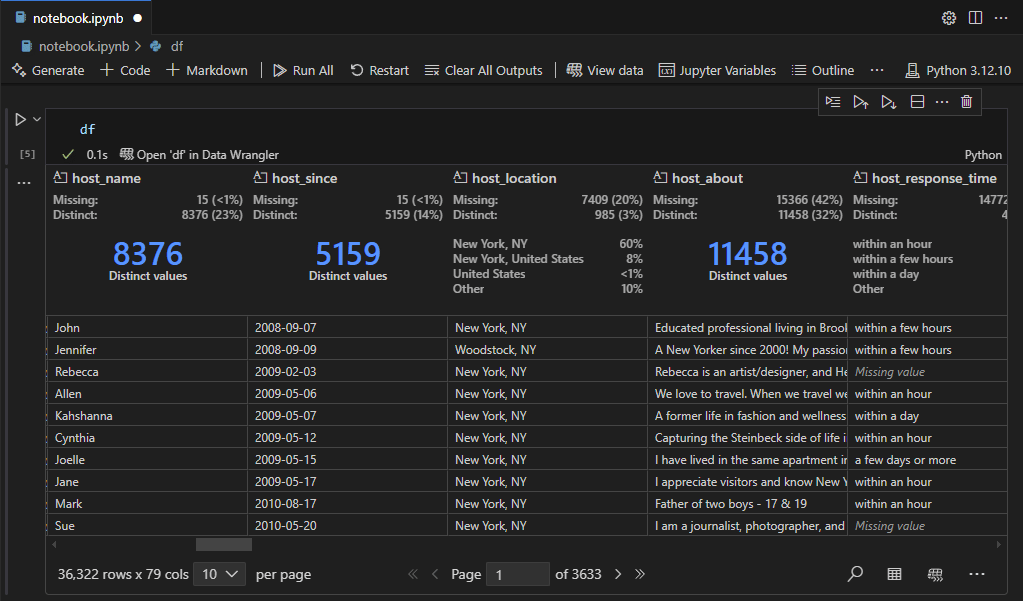
Missing (blank) and distinct values are auto detected
You can instantly know if a column contains missing (blank) values or repeating values you did not expect just by glancing at the column header.
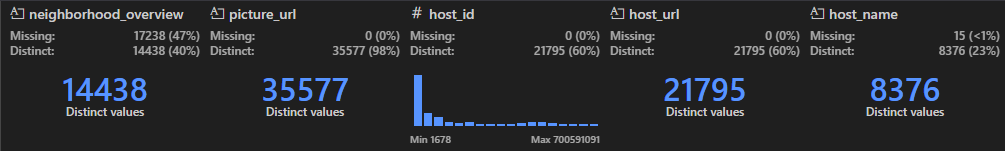
Deep data insights at your fingertips
Access summaries, statistics, histograms, frequency, and more, all instantly and without leaving the context of your notebook cell.
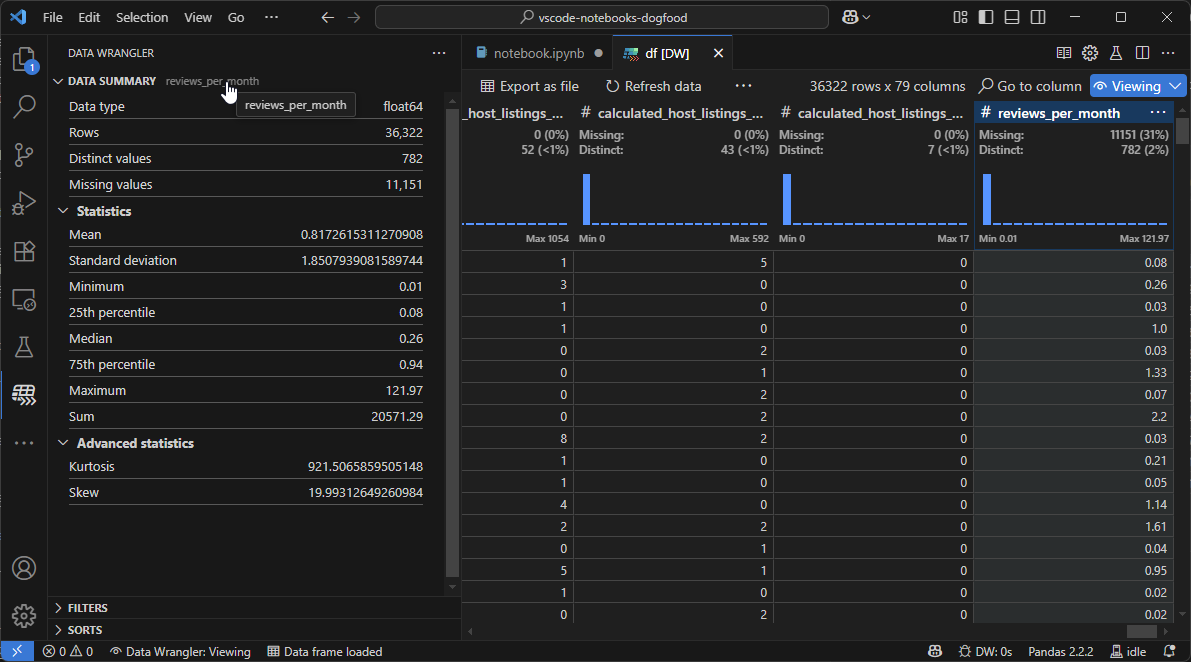
Full view mode + Copilot
With just one click you can jump into the full Data Wrangler experience for even more data cleaning operations and Copilot powered data cleaning. Going back to the notebook view is just one click away.
Export as csv or parquet
Export your data as CSV or Parquet files for further analysis or to feed it into a pipeline.
Getting started today
To try out this experience today, make sure you have the free Data Wrangler extension for VS Code installed. Then, run any Pandas DataFrame in your Jupyter notebook inside VS Code, and watch as Data Wrangler immediately enhances the output with powerful, interactive features (running a cell with just your DataFrame df is enough to get started).
As we iterate to make Data Wrangler the best data exploration and preparation tool, we want to hear from you! If you have any feedback about this experience, please let us know in our GitHub repository.
Elevate your data science workflow and enjoy a more intuitive way to work with your data today!
The post Announcing the Data Wrangler powered Notebook Results Table appeared first on Microsoft for Python Developers Blog.